


Sweden_definitivo
Sweden - 2020 Total Mortality
Regarding Sweden, according to the website of the Swedish Statistics Center (www.scb.se), the total number of deaths in Sweden in 2020 that appears is 98,124 people. I put the link to the web address of SCB:
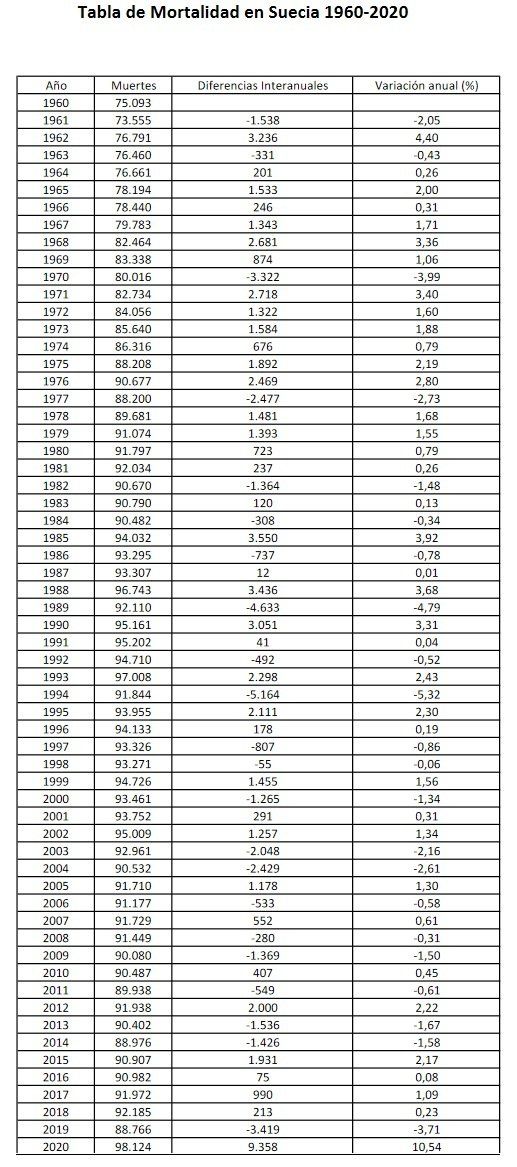
According to this 2020 Mortality data, the Table of Mortality in Sweden (1960-2020) would be the following:
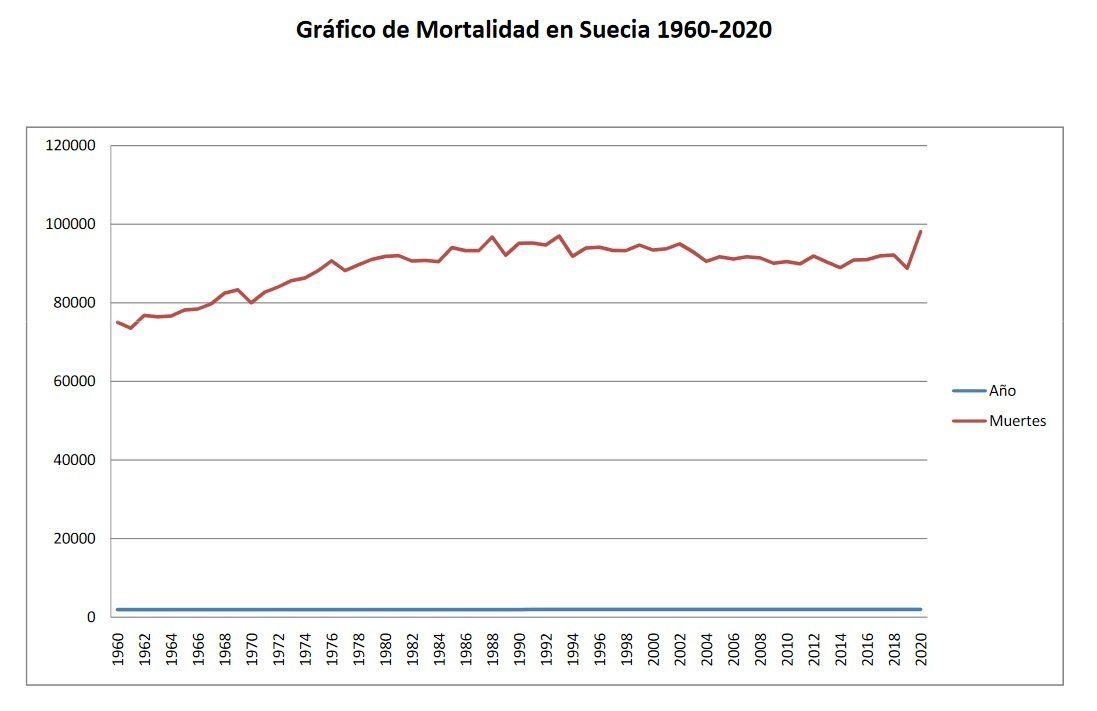
Consequently, the Historical Mortality Graph in Spain (1960-2020) would be the following:
Conclusions (Questions and Answers):
1. How many deaths in total had this year 2020 in Sweden according to the data available to date?
Total deaths in 2020 in Sweden were 98,124, according to the Swedish Statistics Center (SBC).
2. Were there more deaths in 2020 than in 2019?
Yes, more people died in 2020 than in 2019. 9,358 more people have died than in 2019. This represents an increase in mortality compared to 2019 of 10.54%.
Is this a lot of people? How can I compare it to get an idea?
The monthly average mortality in 2019 in Sweden was 7,397 deaths/ month. Well, it would be approximately in terms of mortality as if this year 2020 there had been 1.3 more months than the usual deaths in 2019.
Considering the historical series, there are no precedents for annual percentage increases in mortality of considerably higher values in Sweden. In 1962, it should be noted an increase in total annual mortality of 4.40%; in 1985 there was an increase in total annual mortality of 3.92%; in 1988 there was an increase in total annual mortality of 3.68%.
3. Can we draw any conclusions from the long-term perspective of mortality?
Sweden is standing this year 2020, as can be seen in the graph, above the level of highs of the late 80s and early 90s, and above the last highs of 2018, so it is at all-time highs.
4. Do all the countries analyzed have a similar situation of variation in mortality this year 2020 of the Global Pandemic?
With the final Mortality data for 2020, all the countries analyzed have increased their mortality compared to 2019, except Australia where it has decreased.
Regarding the countries where Mortality has grown in 2020, where we see important differences is in the proportion of the increase in mortality. Some countries have reasonable or low mortality growths, others medium or high, and others are marking percentages of annual growth in mortality not seen in 60 years.
We also find different situations for each country in the long-term charts.
CTA Street Wear Blog

The absurdocracy could be defined as a new system of organization of the State in which good sense, reasoning and the precautionary principle in its policies, have been in the background overshadowed by a declaration of the Pandemic in 2020 by the WHO, which is used as an excuse to restrict / eliminate the rights of citizens at the same time that it allows the elaboration of new laws with which it is intended to perpetuate this situation of continuous Pandemic.
La absurdocracia se podría definir como un nuevo sistema de organización del Estado en el cual la sensatez, el raciocinio y el principio de precaución en sus políticas, han quedado en segundo plano eclipsados por una declaración de la Pandemia en 2020 por parte de la OMS, y que es utilizada como excusa para restringir/eliminar derechos de los ciudadanos a la vez que permite elaborar nuevas leyes con las que se pretende perpetuar esta situación de continua Pandemia.

We have set out to test the Ubuntu operating system, based on Linux, a little fed up with the continuous mandatory updates at the worst times and attracted by the security offered by an s.o. that hardly has a virus because it is less widespread among the average user.
Nos hemos propuesto probar el sistema operativo Ubuntu, en base Linux, un poco hartos de las continuas actualizaciones obligatorias en los peores momentos y atraídos por la seguridad que ofrece un s.o. que apenas tiene virus por ser menos generalizado entre el usuario medio.

Countries analyzed: Spain, Germany, Italy, United Kingdom, France, Sweden, Norway, Finland, Lithuania, Portugal, USA, Mexico, Russia, Canada, Japan, Chile, Australia.
Países analizados: España, Alemania, Italia, Reino Unido, Francia, Suecia, Noruega, Finlandia, Lituania, Portugal, EE.UU., México, Rusia, Canadá, Japón, Chile, Australia.

On 02-20-2021 We are all with Galicia - Manifestation in Santiago de Compostela.
Time to regain the spirit of cooperation and solidarity from the Prestige environmental catastrophe of 2002? Let's remember and compare.
El 20-02-2021 Todos estamos con Galicia - Manifestación en Santiago de Compostela.
¿Hora de recuperar el espíritu de cooperación y solidaridad de la catástrofe medioambiental del Prestige de 2002? Recordemos y comparemos.