


Japan
Japan
Death Count and Estimation Study in 2020 in Japan - Long-Term Perspective
We continue our Study with Japan, there is a lot of controversy about whether there have been more or less deaths this year 2020 than in 2019, with respect to past averages, and it is normal, since the majority information is focused only on infections and deaths from Covid-19, and the total data on deaths or deaths from all causes during this year 2020 is scarce, or is outdated. It is as if the magnifying glass were focused only on what is Covid 19, and stopped attending to the rest of the deaths. If something is clear to us, it is that the death toll is an objective data that can help us understand the current situation, its long-term perspective, and be able to analyze the situation as a whole.
Preamble:
The Study uses real and official data when they are available in number, when they are not available, data taken manually from official graphs is used, and when there is no data, data are extrapolated in two possibilities:
1) Normal Conditions (N.C.): Long-term mortality (59-year-old sample) carries with it a growth inertia that affects this year 2020 regardless of the Pandemic, this growth will be applied to the year 2020 for the calculations of each country.
2) Pandemic Conditions (P.C.): In this case we will apply the Mortality of the data that we have from this year 2020 to find the estimated figure of Total mortality for 2020.
With these two hypotheses we will be able to establish a Predictable Mortality Rate Range for 2020. The lower of these two data will be the one that is incorporated into the Table with the Lower Rank 2020 Mortality Hypothesis. The larger of these two data will be the one that is incorporated into the 2020 Higher Rank Mortality Hypothesis Table.
Once the data have been integrated into the historical series, we will have the result of the 1960-2020 graph for each of the Hypotheses (Lower and Upper Range).
Below we will describe the Study, its procedure, data, assumptions, calculations and graphs. If you prefer, you can also go directly to the Study Conclusions.
Start Data:
Historical series of mortality in Japan from 1960 to 2018 (source: article on Mortality in the financial newspaper Expansión).
Mortality data for 2019 in Japan: 1,361,440 deaths. (source: website knoema.es (World Data Atlas).
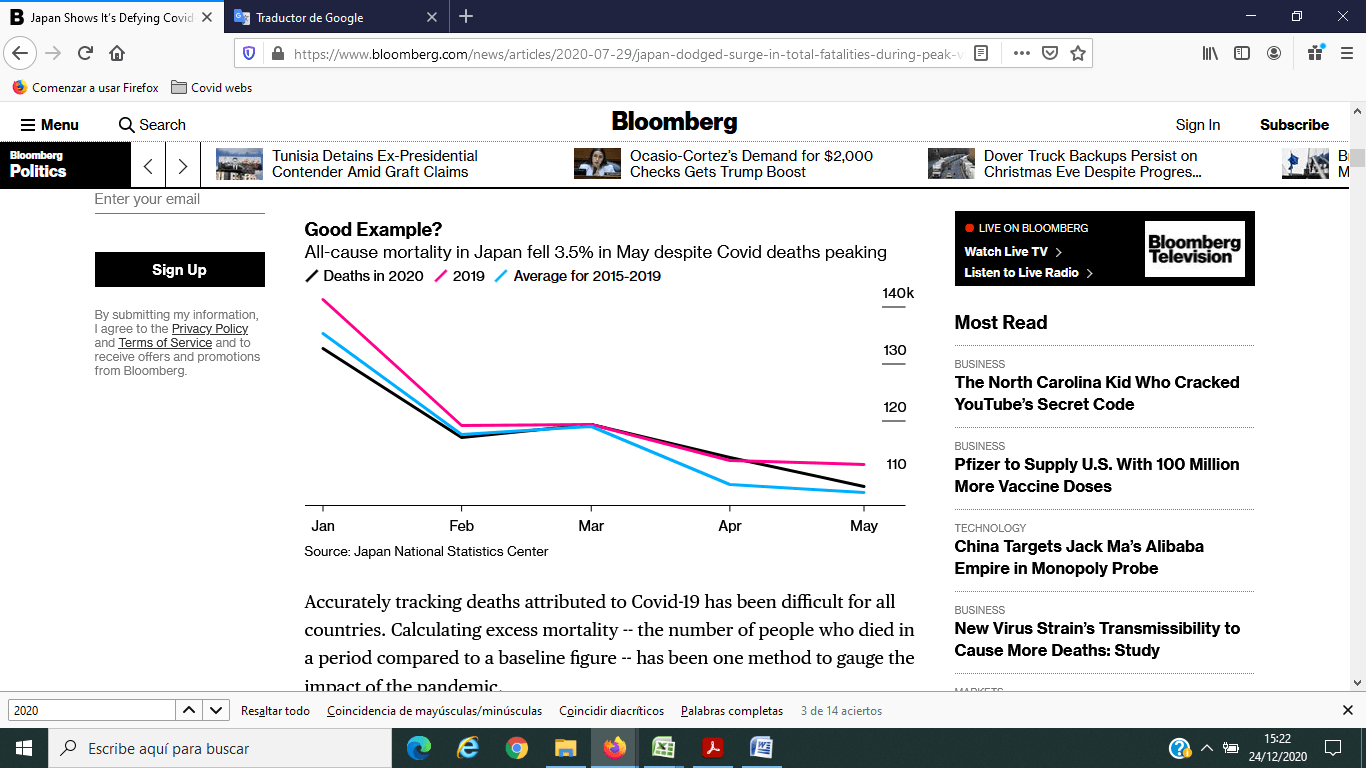
Mortality data for the period 01/01/2020 to 30/04/2020 (source: Bloomberg news graph of 29/07/2020).
1) Calculation of the% Average Growth of Predictable Mortality in 2020:
In this case we do not have the Mortality data in 2019, we can find it on the knoema.es website (World Data Atlas). By analyzing the long-term trend of mortality between 1960 and 2019, it can be deduced that Mortality has grown by an average of 1.59% per year during this period of time.
With the 2019 data, the 2020 Death data is updated and its monthly and daily average values are found. These data reflect the variation in Mortality for 2020 due to its long-term context, without there having been a Pandemic, and we will use these data to complete the information that we do not have in the case under Normal Conditions.
2) Estimate of Predictable Mortality for 2020 in Normal Conditions (N.C.):
With the specific data from the graph of the Bloomberg news of 29/07/2020), making some measurements in the table and calculations, we have to give us the total mortality for a period:
459,500 total deaths from 01/01/2020 to 30/04/2020.
It will be assumed that for that remaining period (01/05/2020 - 31/ 12/2020), Mortality will continue in Normal conditions, and will be completed with the information on Predictable Deaths for 2020.
Adding the mortality for all the periods of the year we will have the Predictable Mortality Estimate for 2020 in Normal Conditions.
3) Estimate of Predictable Mortality for 2020 in Pandemic Conditions (P.C.):
With the specific data from the graph of the Bloomberg news of 29/07/2020), making some measurements in the table and calculations, we have to give us the total mortality for a period:
459,500 total deaths from 01/01/2020 to 30/04/2020.
The procedure is the same as in the previous point, using real numerical data for the period we have, it varies only when it is necessary to estimate the mean mortality of the days of the year for which no data is available.
For this case of Pandemic Conditions, what we will do is transfer the data for this year until December, until the end of the year, calculating the average daily Mortality for the period for which we do have data. And we will apply it to the period without data. It is important to say that in the cases of having a long period of time with real data, the results will be different than if we have a short period of time with real data. In other words, in cases where we have a long period with real data on real deaths for 2020, the assumptions will have to be lower than if we have real data from a short period of the year and we have to assume many months. The margin of error will also be different accordingly, another thing is how that error affects the long-term chart, which we will see later.
Consequently, in Pandemic Conditions, the average number of deaths up to the date on which we do have data for this year 2020 (01/01/2020 - 30/04/2020) is applied to the rest of the year, which is to give that inertia of mortality of this same year 2020.
Study Documentation:
- Calculations.
- Historical Mortality Table and Graph with the incorporation of the 2020 Forecast (C.N.) - Lower Range of Estimated Mortality.
- Historical Mortality Table and Graph with the incorporation of the 2020 Forecast (C.P.) - Upper Range of Estimated Mortality.
- Conclusions.
- Sources